


Statistic 통계
산업동향DB
Statistic- Statistic
Production by Demand
(Unit : million USD)
| Division | 2019 | 2020 | 2021 | 2022 | 2023 | 2024(E) | ||||||
|---|---|---|---|---|---|---|---|---|---|---|---|---|
| Figure | Figure | YoY growth rate(%) |
Figure | YoY growth rate(%) |
Figure | YoY growth rate(%) |
Figure | YoY growth rate(%) |
Figure | YoY growth rate(%) |
||
| Supply | Domestic | 4,975 |
4,055 |
-18.4% |
4,139 |
2% |
4,908 |
18.5% |
5,784 |
17.8% |
5,626 |
-2.7% |
| Imported | 5,078 |
3,335 |
-34.3% |
3,387 |
1.5% |
3,958 |
16.8% |
6,003 |
51.6% |
6,106 |
1.7% |
|
| Total | 10,053 |
7,391 |
-26.4% |
7,526 |
1.8% |
8,867 |
17.8% |
11,787 |
32.9% |
11,732 |
-0.4% |
|
| Demand | Domestic | 7,286 |
5,816 |
-20.1% |
5,964 |
2.5% |
6,950 |
16.5% |
9,073 |
30.5% |
9,130 |
0.6% |
| Overseas | 2,766 |
1,574 |
-43% |
1,562 |
-0.7% |
1,916 |
22.6% |
2,713 |
41.6% |
2,604 |
-4% |
|
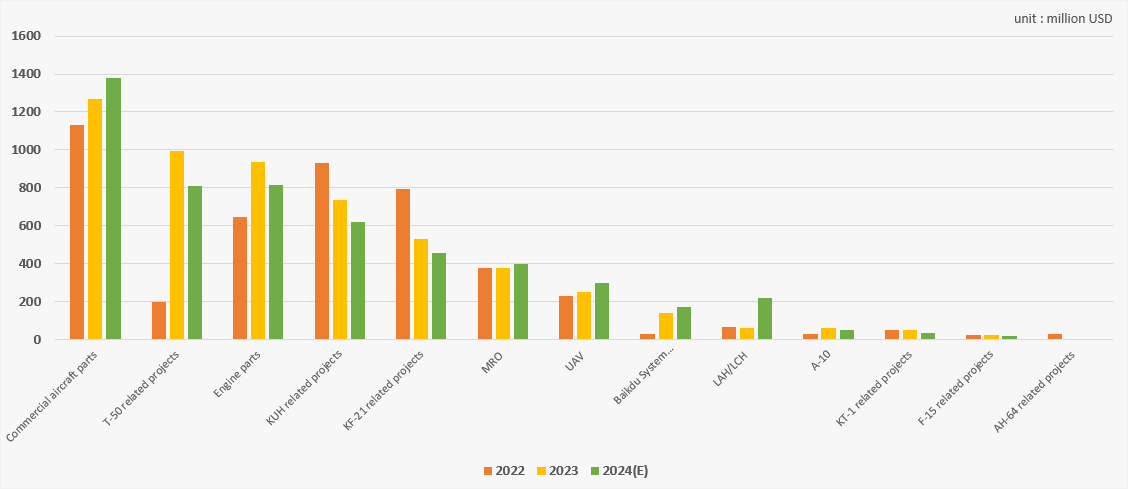
Production scale by Programs
(Unit : million USD)
| Program | 2019 | 2020 | 2021 | 2022 | 2023 | 2024(E) | |
|---|---|---|---|---|---|---|---|
| Production amount |
Portion(%) | ||||||
Commercial aircraft parts |
1,710 |
981 |
866 |
1,130 |
1,267 |
21.9% |
1,380 |
T-50 related projects |
514 |
158 |
202 |
200 |
996 |
17.2% |
812 |
Engine parts |
405 |
260 |
488 |
644 |
936 |
16.2% |
813 |
KUH related projects |
697 |
832 |
863 |
932 |
733 |
12.7% |
619 |
KF-21 related projects |
503 |
711 |
809 |
794 |
532 |
9.2% |
454 |
MRO |
378 |
335 |
305 |
376 |
375 |
6.5% |
400 |
UAV |
140 |
169 |
50 |
229 |
248 |
4.3% |
300 |
Baikdu System Enhancement Project |
0 |
0 |
0 |
30 |
142 |
2.5% |
171 |
LAH/LCH |
76 |
61 |
63 |
64 |
58 |
1.0% |
221 |
A-10 |
0 |
0 |
1 |
27 |
58 |
1.0% |
48 |
KT-1 related projects |
13 |
43 |
33 |
49 |
50 |
0.9% |
33 |
F-15 related projects |
38 |
37 |
7 |
23 |
22 |
0.4% |
16 |
AH-64 related projects |
52 |
6 |
1 |
30 |
0 |
0.0% |
0 |
others |
450 |
464 |
453 |
380 |
369 |
6.4% |
359 |
| Total | 4,975 |
4,056 |
4,140 |
4,908 |
5,784 |
100.0% |
5,626 |
- Business Production Status
Production Status by Demand
(Unit : million USD)
| Division | 2019 | 2020 | 2021 | 2022 | 2023 | 2024(E) | ||||||||||||
|---|---|---|---|---|---|---|---|---|---|---|---|---|---|---|---|---|---|---|
| Domestic | Export | Total | Domestic | Export | Total | Domestic | Export | Total | Domestic | Export | Total | Domestic | Export | Total | Domestic | Export | Total | |
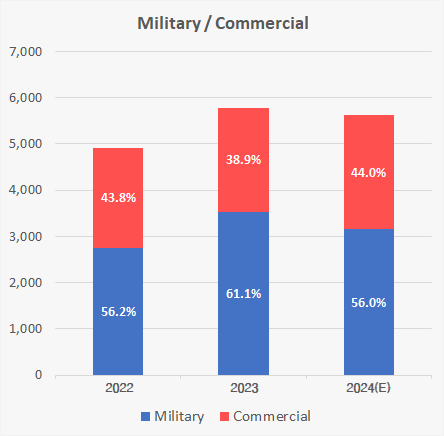
| Military | 1,874 |
745 |
2,619 |
2,236 |
405 |
2,641 |
2,387 |
327 |
2,715 |
2,509 |
248 |
2,757 |
2,533 |
1,002 |
3,535 |
2,471 |
680 |
3,151 |
| Commercial | 335 |
2,022 |
2,356 |
244 |
1,170 |
1,415 |
190 |
1,235 |
1,425 |
483 |
1,669 |
2,151 |
537 |
1,712 |
2,249 |
551 |
1,924 |
2,475 |
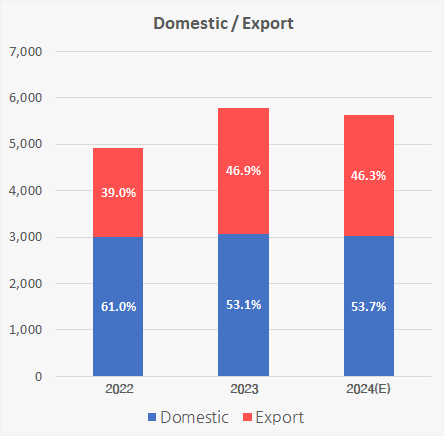
| Total | 2,209 |
2,767 |
4,975 |
2,481 |
1,575 |
4,056 |
2,577 |
1,562 |
4,140 |
2,992 |
1,916 |
4,908 |
3,071 |
2,714 |
5,784 |
3,022 |
2,604 |
5,626 |
Military/Commercial & Domestic/Export
(Unit : million USD)
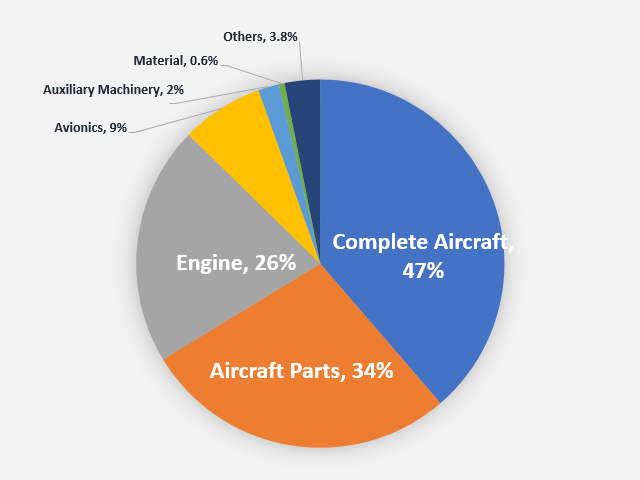
Production Status by Items
(Unit : million USD)
| Division | 2019 | 2020 | 2021 | 2022 | 2023 | 2024(E) |
|---|---|---|---|---|---|---|
Complete Aircraft |
1,738 |
1,825 |
1,688 |
1,482 |
2,238 |
2,071 |
Aircraft Parts |
2,051 |
1,267 |
1,079 |
1,443 |
1,597 |
1,668 |
Engine |
732 |
555 |
816 |
1,146 |
1,217 |
1,077 |
Avionics |
214 |
267 |
428 |
490 |
418 |
495 |
Auxiliary Machinery |
157 |
90 |
87 |
64 |
106 |
102 |
Material |
3 |
4 |
2 |
28 |
29 |
32 |
Others |
80 |
47 |
40 |
255 |
180 |
182 |
| Total | 4,975 |
4,056 |
4,140 |
4,908 |
5,784 |
5,626 |
Production Rate by Items
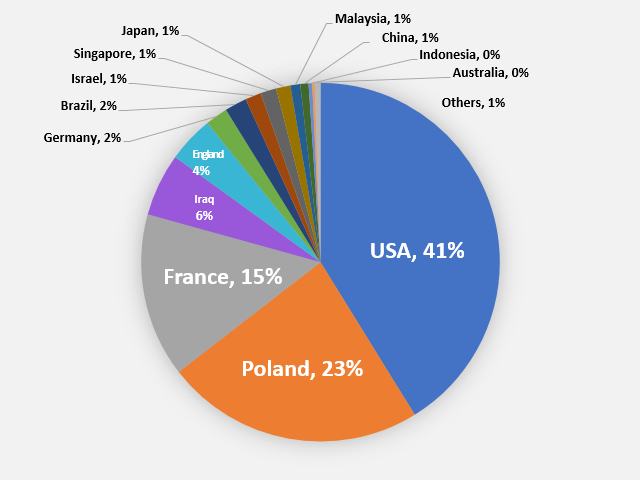
Export by Country
(Unit : million USD)
| Division | 2019 | 2020 | 2021 | 2022 | 2023 | 2024(E) |
|---|---|---|---|---|---|---|
USA |
1,095 |
649 |
813 |
1,007 |
1,118 |
1,297 |
Poland |
0 |
0 |
0 |
0 |
633 |
207 |
France |
554 |
308 |
310 |
397 |
401 |
433 |
Iraq |
336 |
109 |
62 |
45 |
154 |
237 |
England |
92 |
44 |
44 |
64 |
113 |
139 |
Germany |
22 |
24 |
66 |
54 |
55 |
59 |
Brazil |
48 |
42 |
34 |
163 |
54 |
79 |
Israel |
0 |
8 |
18 |
1 |
39 |
41 |
Singapore |
0 |
0 |
18 |
27 |
39 |
38 |
Japan |
223 |
145 |
31 |
26 |
35 |
47 |
Malaysia |
5 |
5 |
13 |
16 |
24 |
18 |
China |
75 |
72 |
5 |
9 |
20 |
21 |
Indonesia |
2 |
3 |
60 |
36 |
9 |
19 |
Australia |
9 |
0 |
3 |
6 |
6 |
8 |
Others |
305 |
166 |
86 |
66 |
14 |
78 |
| Total | 2,767 | 1,575 | 1,562 | 1,916 | 2,714 | 2,721 |
Portion of Export by Country
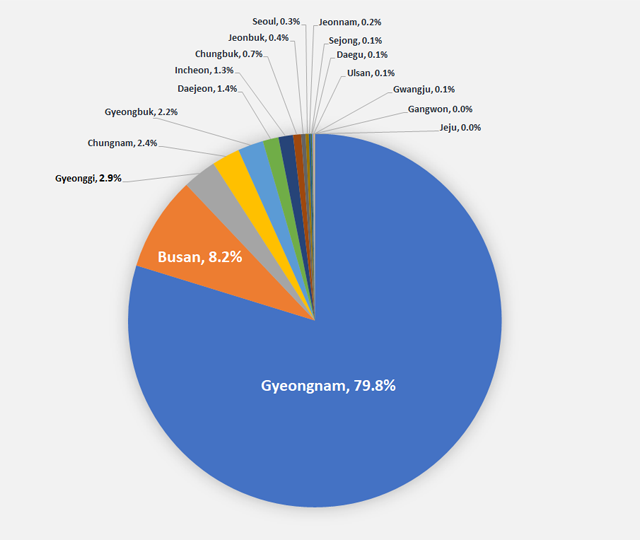
Production by Region
(Unit : million USD)
| Division | 2019 | 2020 | 2021 | 2022 | 2023 | 2024(E) | |
|---|---|---|---|---|---|---|---|
| Production amount |
Portion(%) | ||||||
Gyeongnam |
3,819 |
3,188 |
3,306 |
3,680 |
4,614 |
79.8 |
4,356 |
Busan |
813 |
563 |
342 |
495 |
473 |
8.2 |
496 |
Gyeonggi |
18 |
30 |
37 |
117 |
170 |
2.9 |
237 |
Chungnam |
126 |
70 |
73 |
111 |
140 |
2.4 |
124 |
Gyeongbuk |
134 |
125 |
304 |
286 |
128 |
2.2 |
143 |
Daejeon |
15 |
18 |
13 |
62 |
79 |
1.4 |
77 |
Incheon |
33 |
44 |
47 |
67 |
73 |
1.3 |
73 |
Chungbuk |
11 |
14 |
13 |
34 |
40 |
0.7 |
50 |
Jeonbuk |
4 |
0 |
0 |
15 |
22 |
0.4 |
24 |
Seoul |
2 |
3 |
3 |
16 |
16 |
0.3 |
18 |
Jeonnam |
0 |
0 |
0 |
5 |
10 |
0.2 |
10 |
Sejong |
0 |
0 |
0 |
7 |
6 |
0.1 |
6 |
Daegu |
0 |
0 |
0 |
8 |
6 |
0.1 |
5 |
Ulsan |
0 |
0 |
0 |
2 |
3 |
0.0 |
3 |
Gwangju |
0 |
0 |
0 |
1 |
3 |
0.0 |
3 |
Gangwon |
0 |
0 |
0 |
1 |
2 |
0.0 |
2 |
Jeju |
0 |
0 |
0 |
0 |
0 |
0.0 |
0 |
| Total | 4,975 | 4,056 | 4,140 | 4,908 | 5,784 | 100.0 | 5,626 |
Order/Backlog Status
(Unit : 1 million USD)
| Division | 2019 | 2020 | 2021 | 2022 | 2023 |
|---|---|---|---|---|---|
| Order | 5,705 |
6,659 |
5,156 |
10,831 |
10,672 |
| Backlog | 25,365 |
27,121 |
27,242 |
30,054 |
45,190 |
Employment Status
(Unit : people)
| Division | 2019 | 2020 | 2021 | 2021 | 2023 | 2024(E) |
|---|---|---|---|---|---|---|
| General management | 2,750 |
2,957 |
3,072 |
3,182 |
3,330 |
3,475 |
| R&D | 3,614 |
3,678 |
3,476 |
4,844 |
5,436 |
6,006 |
| Technical work | 2,249 |
2,107 |
1,997 |
3,400 |
3,769 |
4,137 |
| Production work | 6,405 |
5,856 |
5,490 |
7,436 |
8,461 |
9,367 |
| Total | 15,018 | 14,598 | 14,035 | 18,862 | 20,996 | 22,985 |
Note : MRO manpower and government research institute researcher are not included
![]()
TEL : +82-2-761-1101 | FAX : +82-2-761-1175
COPYRIGHT © 2017
Korea Aerospace Industries Association
ALL RIGHTS RESERVED.
admin